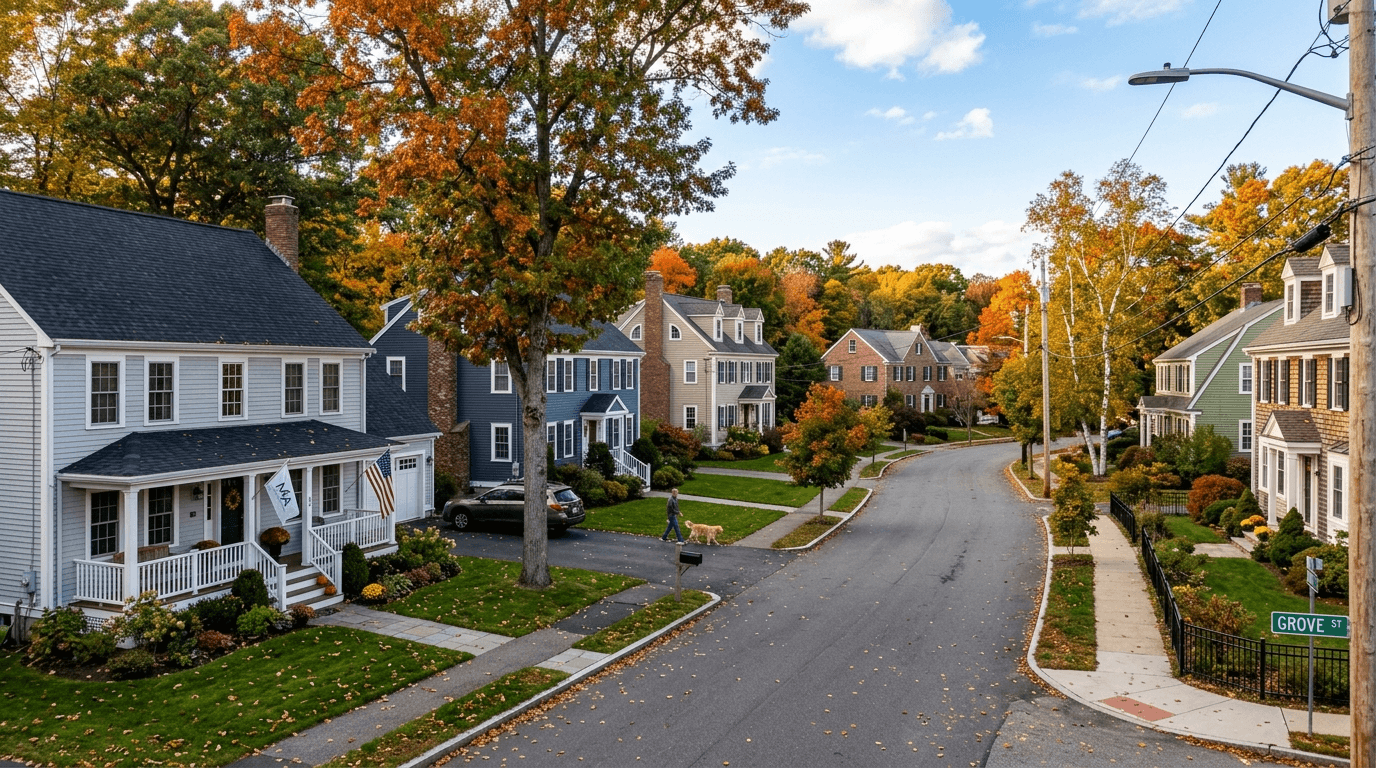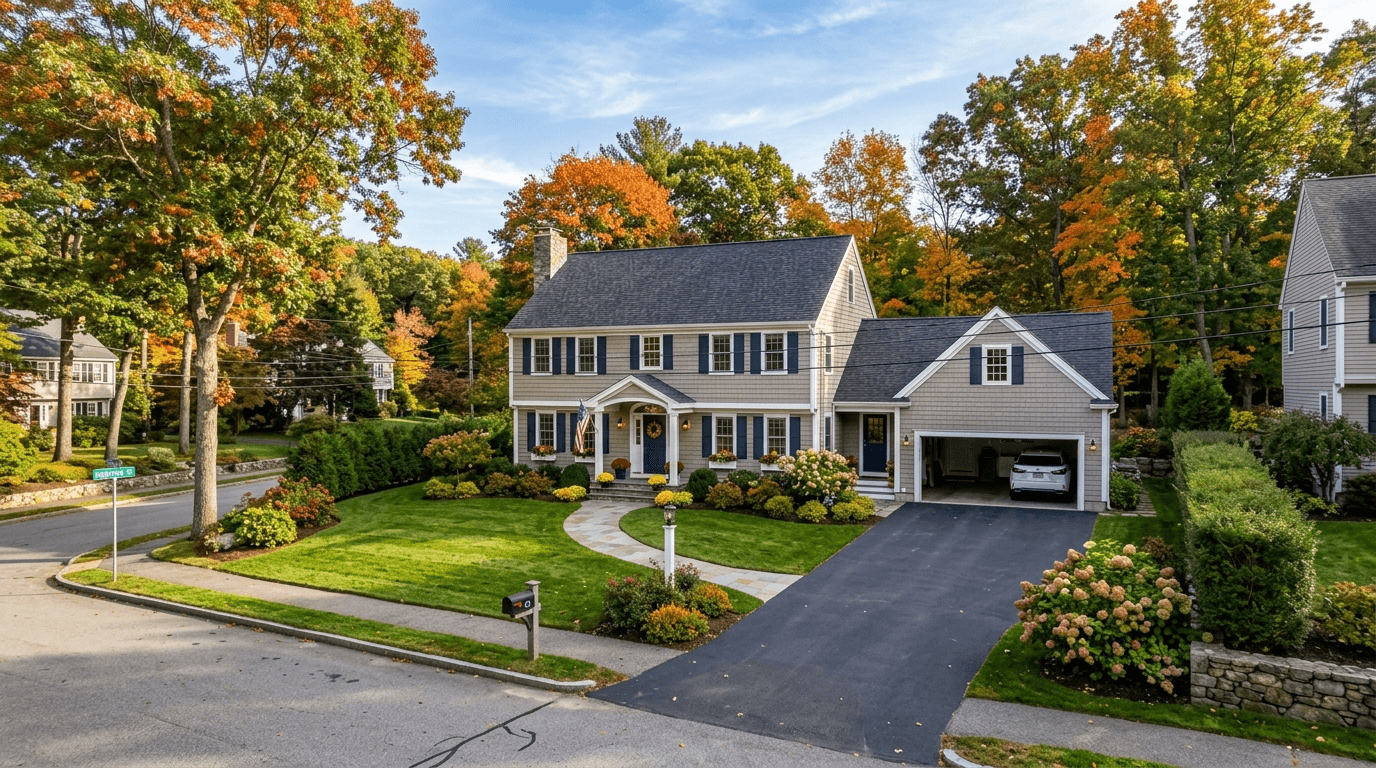

# Buying in Needham? What Is the Tax Bill on a $1.5M Home?
Key Takeaways
•The quick answer: Using Needham's published FY2026 residential rate of $10.83 per $1,000 of value, a $1.5M home works out to about $16,245 a year in property tax right now.
•The catch: That number is already moving. The average single-family bill just rose 7.52% in a single year — an extra $1,167 — according to the Needham Observer.
•The smarter move: Budget off the trajectory, not today's rate. Bills are climbing mainly because homeowners are picking up a growing share of the town's tax load.
•The bottom line: Start at ~$16,245, then stress-test your mortgage against a realistic range of yearly increases — not a frozen number, but not the worst case alone either.
What Tax Bill Should You Expect on a $1.5M Home?
If you're buying in Needham this June, the first number you want is a simple one.
What will the tax bill actually be on a $1.5M home?
Using Needham's FY2026 residential tax rate of $10.83 per $1,000 of assessed value — pulled straight from the Town of Needham's published Current Tax Rates — the math is straightforward:
$1,500,000 × $10.83 ÷ 1,000 ≈ $16,245 per year.
That's your starting point. But it's not the whole story.
Pay attention to the phrase assessed value. That's the town's official valuation of the property, and it may not match what you pay at closing. So while $16,245 per year is a useful estimate, treating it as a fixed, permanent number would be a mistake.
Needham tax bills are moving — and that matters for your monthly budget.
Why Is Today's Tax Rate Not Enough for Your Budget?
The rate itself is easy to find. Understanding where your bill is headed is the harder part — and honestly, the more important one.
Here's why it matters: your mortgage payment isn't just principal and interest. It also includes taxes, insurance, and typically escrow — the money your lender collects each month to cover your tax and insurance bills on your behalf. When taxes rise faster than expected, your monthly payment can climb right along with them. That's where a lot of buyers get caught off guard.
A static estimate tells you: "The rate is $10.83, so I'll budget around $16,245." Clean math. But it misses three things that are very much in play in Needham right now:
•The town reassesses home values.
•Town budgets change year to year.
•The tax burden can shift between homeowners and commercial property owners.
That last point is especially relevant right now. According to the Needham Observer, the average single-family tax bill rose 7.52% in a single year — an increase of $1,167.
Average Single-Family Tax Bill Change in 2026
Summarizes the reported 2026 tax-bill change for the average Needham single-family home.
For the average single-family home, assessed at $1,541,061, the bill moved from $15,523 to $16,690. That's $1,167 more per year, or $291.77 more every quarter.
Worth noting: that average home is assessed slightly above the $1.5M example we're working with, so the raw dollar increase on your home would be a touch smaller. But the percentage is what we'll use for planning purposes.
This isn't a rounding error. A jump like that can quietly reshape how comfortable the home feels once you're actually living in it.
As the Observer put it:
*"With residential property values continuing to grow and commercial values actually declining, the average single-family tax bill will increase by 7.52% in 2026."*
So the better question isn't just, "What's the bill today?"
It's: "What happens if this bill keeps rising?"
Should You Budget Using the Static Rate?
You can — and plenty of buyers do.
Take the FY2026 residential rate of $10.83, apply it to the assessed value, and plug that number into your mortgage budget. For a $1.5M home, that lands at about $16,245 per year, or roughly $1,354 per month.
There's real value in this approach:
•It's simple and easy to explain to a lender.
•It uses the official town rate.
•It gives you a clean, defensible starting point.
The weakness? It assumes your tax bill stays still. In Needham right now, that's not a safe assumption.
If your budget only works at today's bill, you may feel squeezed down the road — through a higher escrow payment, tighter cash flow, or less room for repairs and unexpected costs.
Should You Budget Using the Trajectory Instead?
Yes — but with a calibrated range, not a single worst-case number.
Trajectory budgeting means you start with today's bill, then stress-test what happens if it keeps rising. You're not predicting the future. You're protecting yourself from payment shock.
The table below applies the recent 7.52% increase to an illustrative single-family bill, year over year. Think of it as a stress test, not a forecast.
Needham Property Tax Trajectory on a $1.5M Home
Projects the estimated annual Needham property tax bill and yearly increase for a $1.5M home over two years using the FY2026 residential rate and a repeated 7.52% annual increase assumption.
| Category | Estimated Annual Bill | Yearly Increase |
|---|---|---|
| Year 0 (today) | ~$16,245 | — |
| Year 1 (+7.52%) | ~$17,467 | +$1,222 |
| Year 2 (+7.52%) | ~$18,780 | +$1,313 |
At that rate, the bill climbs to roughly $17,467 next year (+$1,222), then to about $18,780 the year after (+$1,313).
How realistic is a repeated 7.52%? Probably not very — and here's why:
•Massachusetts law (Proposition 2½) caps how fast a town's total tax levy can grow, generally around 2.5% per year, with limited voter-approved exceptions.
•Needham's actual total levy growth has been running well below 7.52%.
•The big one-year jump was largely driven by a shift in burden from commercial to residential property — a dynamic that's unlikely to repeat at the same intensity every single year.
A more grounded planning range is roughly 2.5% to 7.52% per year. The low end reflects the legal cap on total levy growth. The high end reflects a year where the burden shifts hard toward homeowners, as it just did. Budgeting toward the middle-to-upper part of that range gives you a real margin of safety without assuming the worst forever.
A few hundred extra dollars per month can quietly change your quality of life — vacations, childcare, renovations, emergency savings. This is exactly why qualifying comfortably beats stretching on a best-case tax number.
What trajectory budgeting gets you:
•Less risk of a surprise escrow increase.
•A clearer picture of the home's true carrying cost.
•A calmer decision before you waive contingencies or write an offer.
The honest tradeoff:
•It requires assumptions.
•Future bills depend on assessments, town spending, state rules, and local votes.
•A 7.52% increase every year is a cautious upper-bound stress test — not a base case.
Still, when you're buying a high-value home, planning for a range isn't pessimism. It's just good planning.
Why Are Needham Property Tax Bills Rising?
The short version: homeowners are carrying more of the tax load.
Needham taxes both residential and commercial property. When commercial values weaken, there's less business-side value to tax — so more of the total burden lands on homeowners. That's why the tax rate alone can look manageable while your actual bill still climbs.
Two different "residential share" numbers tend to come up in these conversations, and they measure different things:
•Share of assessed value: the portion of the town's total property value that is residential.
•Share of the tax levy: the portion of actual dollars collected that comes from homeowners.
These aren't the same thing. What matters for your budget is the direction: residential values are rising while commercial values are falling, which steadily pushes more of the bill onto homeowners over time.
For you as a buyer, the practical takeaway is to focus on the bill — not just the rate.
How Does Needham Compare With Newton and Wellesley?
If you're cross-shopping Needham against Newton or Wellesley, that's a smart instinct. But don't compare towns by tax rate alone.
A lower rate doesn't automatically mean a lower bill. A higher rate doesn't automatically make a town a worse deal. To get a real comparison, you need three things:
•The assessed value of the specific home.
•The applicable tax rate.
•The direction of the town's tax burden over time.
In Needham, the gap between residential and commercial rates tells part of the story:
Needham FY2026 Tax Rates: Residential vs. Commercial
Compares Needham’s FY2026 residential and commercial tax rates from the town’s current tax-rate page.
Needham's FY2026 commercial rate is $21.09 per $1,000 — nearly double the residential rate. But if commercial values are shrinking, that higher rate applies to a smaller base. Homeowners can still end up shouldering more of the total bill even when their own rate looks reasonable.
The takeaway for buyers is simple: shop by total carrying cost, not tax rate. That means mortgage, taxes, insurance, maintenance, and realistic increases over time — all in.
Why Is More of the Bill Landing on Homeowners?
This isn't a Needham-specific story. CNN has described the current moment as "the biggest property tax revolt in 50 years," noting that real-estate values have surged almost 27% faster than inflation since 2020 and that 34 states passed property tax reforms between 2020 and 2025.
Massachusetts buyers should be careful about reading too much into that national trend, though. A major rollback isn't something Needham homeowners should count on. The local math still matters most.
When residential values rise and commercial values fall, homeowners absorb more of the cost — even when the tax rate itself doesn't look alarming. For your budget, that's the key insight:
The risk isn't just one high year. It's the direction of the burden.
That's why stress-testing taxes before you make an offer on a $1.5M home is worth the effort.
What Are the Best Arguments Against Budgeting for Big Increases?
Fair question — and worth taking seriously. Here are the strongest counterpoints, along with an honest read on each.
Could the 7.52% Increase Be a One-Year Jump?
Yes, and this is actually the most likely reading of the data.
Proposition 2½ limits how much Needham can grow its total tax levy each year — generally around 2.5%, with voter-approved exceptions. A 7.52% rise in the average single-family bill doesn't mean total tax revenue grew by that amount. Total levy growth is capped well below that figure.
That tells you the 7.52% was mostly about how the burden was divided between homeowners and businesses — not runaway total tax growth.
What this means for the stress test: A repeat of 7.52% every year is unlikely. The more durable risk is the slow, ongoing shift of burden toward homeowners. That's why a planning range of roughly 2.5%–7.52% makes more sense than anchoring to either extreme.
Could Commercial Values Rebound and Ease the Pressure?
Yes — and if they do, the residential share could fall, easing some pressure on homeowners.
But the current pattern points the other way. The Needham Observer frames the commercial decline and residential rise as a structural tension, and notes that a key piece of state aid has been frozen at 2009 levels for 16 years. That points to continued pressure on residential taxpayers, even if a rebound is possible.
This is a real but uncertain upside. Worth knowing about — but not something to build your home-buying budget around.
What If the Rate Data Looks Confusing?
This is a fair concern, and it actually cuts against alarm rather than toward it.
If you compare a higher prior-year figure to the official FY2026 residential rate of $10.83, the rate appears to have fallen. So why do bills still go up? Because the rate is only half the equation. When assessed values rise faster than the rate falls, the bill can still increase — a lower rate applied to a higher assessed value can produce a bigger number.
That's exactly why we focus on the actual dollar bill:
$15,523 → $16,690
That's a 7.52% rise in the average single-family bill. A falling rate is a reason to look more carefully, not a reason to feel reassured.
What Should You Actually Budget for a $1.5M Home?
Here's the practical answer.
Start with the current estimate of about $16,245 per year. Then stress-test your monthly budget using a realistic range of yearly increases.
The recent jump in the average single-family bill was 7.52% — $1,167 more per year, or $291.77 more per quarter. That's the high end of what a single year can look like. The low end, set by Proposition 2½, is closer to 2.5% on total levy growth.
You don't need to assume every year hits the ceiling. But you should make sure your budget still works if taxes trend toward the upper part of that range.
Before you write an offer, ask yourself:
•Can I afford this home if the tax bill rises next year?
•Will my escrow payment still feel manageable?
•Do I have cash left over for maintenance?
•Am I budgeting off today's number, or a realistic future one?
If the answers feel tight, that doesn't always mean "don't buy." It might mean you need a different price point, a sharper offer strategy, or a clearer read on the home's assessed value.
Can You Push Back If the Assessment Looks Too High?
Yes. Needham allows property tax abatements — a formal process to request a lower tax bill if you believe the town assessed your home above its actual value.
This can matter after you close. If the assessed value seems out of line with comparable homes, an abatement is worth exploring. It's not guaranteed, but it's a real tool that buyers often overlook.
The smarter move is to understand the assessment before closing, so you're not caught off guard later.
Is the Higher Tax Bill Worth It in Needham?
For many buyers, yes — but "worth it" should rest on the full picture, not a single number.
Needham's tax bills fund the schools, public safety, and quality of life that draw buyers here in the first place. On the public safety side, for example, the town reports a violent crime rate of 52 per 100k — well below the Massachusetts benchmark of 315 per 100k and the U.S. benchmark of 359 per 100k.
Violent Crime Rate Benchmark: Needham vs. State and U.S.
Benchmarks Needham’s reported violent crime rate against Massachusetts and the United States.
That's just one data point. The same logic applies here as it does with taxes: weigh schools, commute, services, lifestyle, and total carrying cost together. No single stat tells the whole story.
The goal isn't to be scared off by the tax bill. The goal is to buy with your eyes open.
For a $1.5M Needham home, the current estimate is about $16,245 per year. The smarter move is to plan for where that bill may be going — within a realistic range — not just where it sits today.
Run the full carrying-cost picture before you write the offer. If you're looking at a specific Needham home, send over the address and price range. We can help you estimate the tax bill, compare the assessment, and stress-test the monthly payment before you commit.