
# Shifting Leverage: How Needham Buyers Can Exploit March's Micro-Market Divergence
Key Takeaways
•The Myth: Buyers have zero leverage in the highly competitive Needham MA real estate market 2026, expecting to pay massive premiums across the board.
•The Reality: The market has fractured. While turnkey homes still spark fierce bidding wars, dated properties are sitting longer, creating distinct zones of opportunity.
•The Bottom Line: Your best Needham buyer negotiation strategy is to target "dated utility" over curb appeal, using time on the market to negotiate favorable terms rather than expecting massive price cuts.
What is the Reality of the Needham Real Estate Market in 2026?
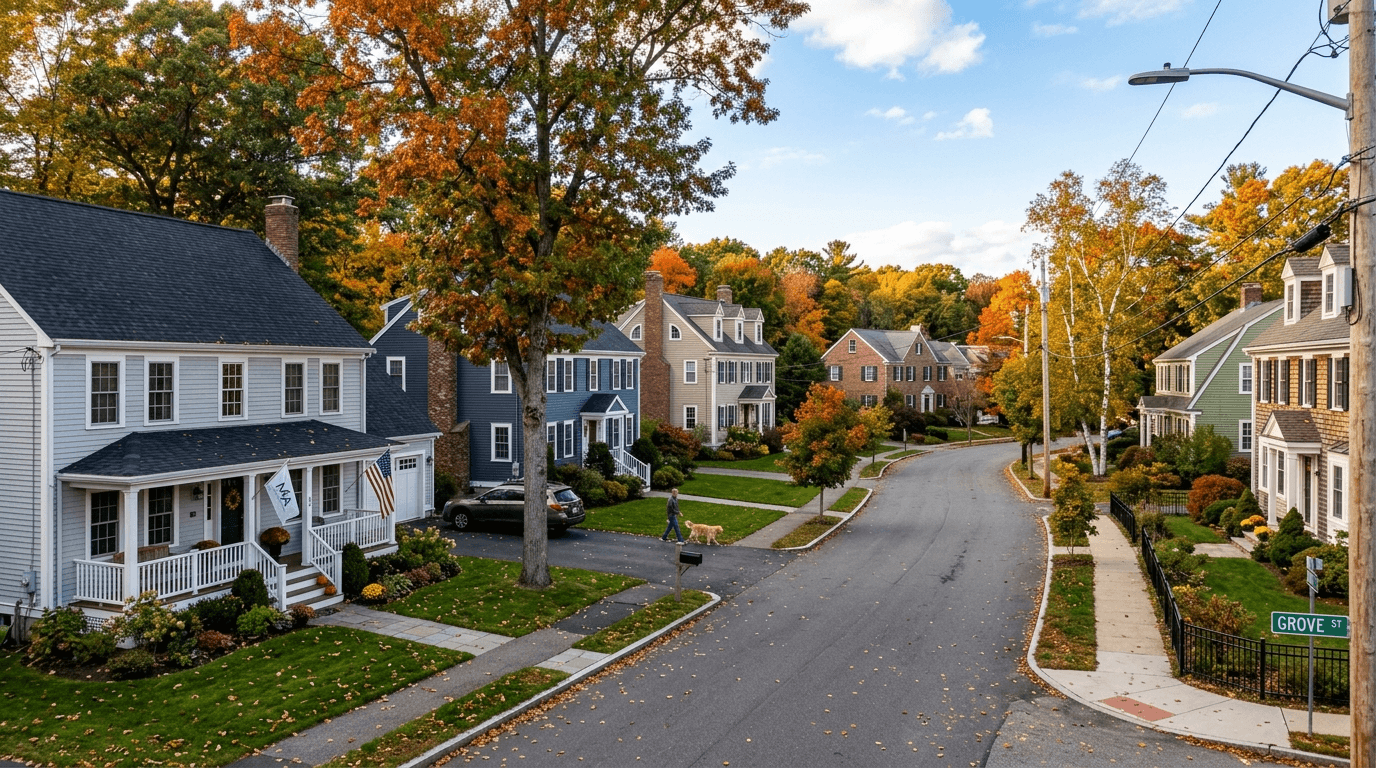
Here's the honest answer if you're trying to figure out where you can negotiate in Needham right now—and where you simply can't: Needham isn't one market. It's multiple micro-markets, each playing by its own rules.
As a Realtor active in this community—and someone who actually lives here in Needham—I watch the daily disconnect between national headlines and what's happening street by street. Most buyers entering the spring market assume they have zero power. They walk in already braced for waived inspections and appraisal gaps, ready to absorb whatever the market throws at them.
The data tells a more nuanced story.
March is revealing a genuine split-screen market—a sharp divergence between parade-ready, family-friendly homes and larger, older layouts that need work. The average sale price as a percentage of asking sits at 97% (a 1.09% decrease compared to January). That slight dip matters, because it proves negotiation is happening. Just not on every house. Meanwhile, with 30-year mortgage rates hovering around 5.75% as of early March, financed buyers are finally returning to the table with a bit more purchasing power than they've had in years.
Needham, MA Housing Market — Headline Metrics (Early 2026)
A quick, mixed-units snapshot combining pricing, inventory, sales volume, and market speed from Redfin and Movoto.
Pricing (Redfin)
Median sale price (last month)$2.6M
Median sale price YoY change60.9%
Median sale price per sq ft$557
Price per sq ft YoY change11.0%
Market activity (Movoto)
Active listings51
New listings14
Homes sold (Feb 2026)41
Speed (Redfin)
Avg days on market (Jan 2026)32 days
Source:Redfin; Movoto
"If you aren't ready to move quickly, the inventory you saw may vanish before you can act — so it effectively wasn't inventory for your timeline."
What does 97%-to-ask actually mean for you?
The automatic over-asking era isn't universal anymore. But the homes that feel easiest to live in on Day 1? They still command a premium—full stop.
Key Takeaway
Your negotiation map is straightforward: you'll win on dated utility, not on flawless aesthetics. That's where the leverage lives.
Why Are Needham Home Prices So High in March 2026?
High prices can feel personal, like you're doing something wrong as a buyer. You're not. What you're seeing is the result of years of pressure that finally found a release valve.
To understand today's leverage, you need a quick look at the decade-long trajectory that brought us here. The story really crystallized during the brutal lock-in effect of 2023 and 2024. When mortgage rates peaked near 8%, inventory froze. Nobody wanted to trade a 3% rate for an 8% rate, so sellers stayed put and buyers waited.
Now, with rates dropping back into the mid-5% range, that pent-up demand has come flooding back—chasing a slow trickle of new listings. The result? Average sale prices spiked to $1.2M (a 26.05% increase month-over-month) for certain property segments over late winter, setting a very high floor heading into spring.
Inbound Relocation Interest to Needham — Top Origins (Oct–Dec 2025)
Compares the largest inbound origin metros by net inflow count for the Oct–Dec 2025 period.
Underneath those headline numbers, though, something interesting is happening. Needham MA housing inventory is slowly thawing. We tracked a 300% increase in new properties hitting the market in late winter. More listings don't automatically mean cheaper homes—but they do mean more choices, and choices are exactly what create leverage.
What does the "inventory thaw" mean for your negotiation power?
The market is fragmenting. Buyers who know which slice of inventory to target are finding real opportunities that didn't exist six months ago.
Key Takeaway
Prices are high because years of pent-up demand are finally being unleashed. But the slow return of inventory means the market is no longer a monolith—and that's good news if you know where to look.
Where Can Buyers Actually Negotiate in Needham?
This is the heart of the 2026 negotiation map: your leverage depends entirely on which slice of inventory you're targeting.
When you compare dated homes versus turnkey Needham properties side by side, the data paints a stark picture.
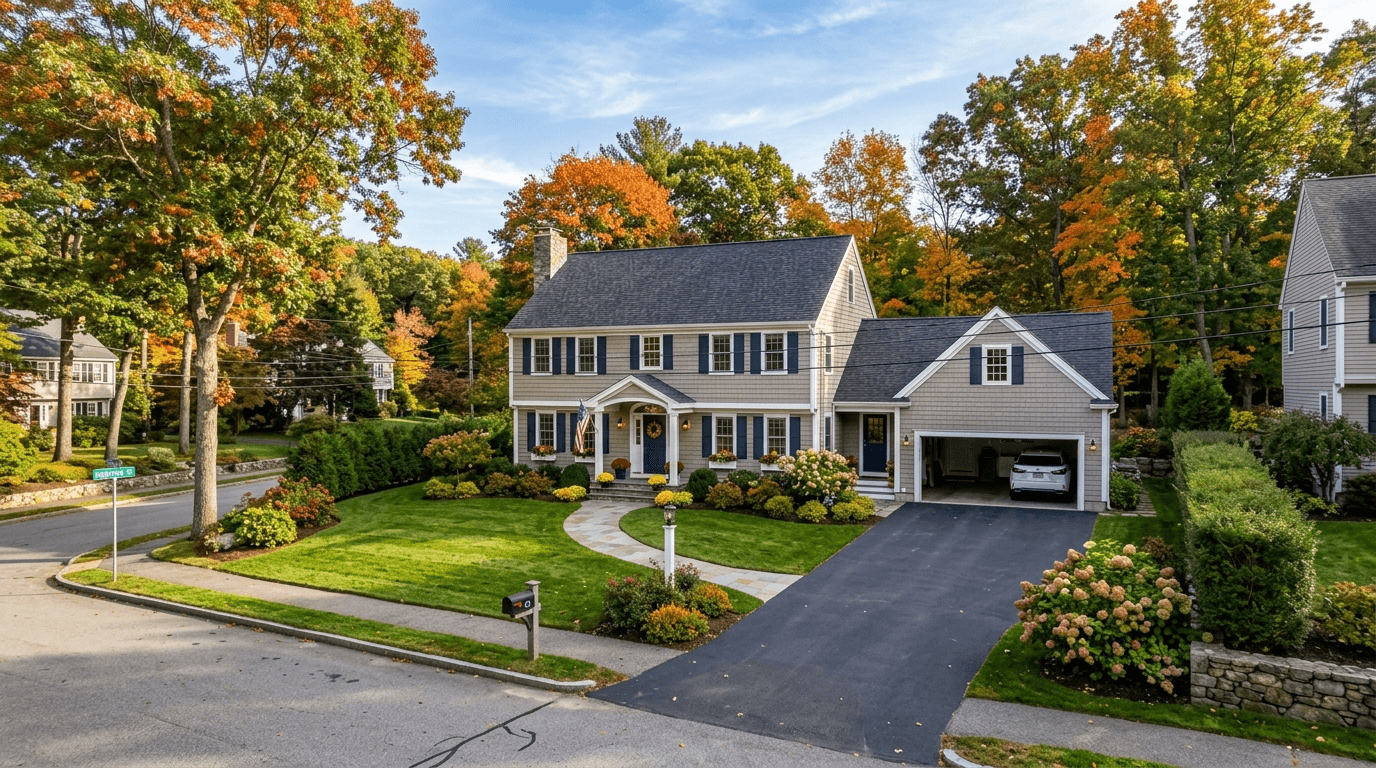
In the coveted 02492 zip code, high-end, move-in-ready inventory remains virtually untouchable. There are only about 19 active listings in that area right now, with a median list price of $2.64M. These homes fly off the market in single-digit days at significant price-per-square-foot premiums. If you need turnkey in 02492, your "negotiation" is really about how clean and reliable your offer looks—financing strength, timeline, deposit size—not about landing a bargain.
Buyers willing to look past cosmetic flaws are finding a completely different reality. Homes needing updates are sitting on the market far longer, and that time creates leverage. By targeting these older layouts, you can negotiate on price or favorable terms, securing a foothold in a premium town without paying the full "turnkey tax."
Recent Needham Sold Homes — Sale Price vs. Square Footage (Sample Listings)
Scatter-ready dataset intended to plot sale price against home size using individual sold listings (as provided).
Sold listing
Here's what that split-screen reality looks like in plain numbers:
Data Table
| Market Segment | Avg. Price Per Sq. Ft. | Avg. Days on Market | Buyer Leverage |
|---|---|---|---|
| Turnkey Luxury | $976 | 9 Days | Low (Bidding Wars) |
| Dated Utility | $658 | 60 - 74 Days | High (Negotiable Terms) |
What does $976 versus $658 per square foot mean for your wallet?
That gap is the turnkey tax, spelled out in plain English. If you can tolerate some disruption—or stage renovations over time—you may be buying the same town, the same schools, and the same commute at a dramatically different entry point.
Key Takeaway
Stop competing for the flawless homes. Targeting properties with a lower price per square foot that have been sitting for over 60 days is often your strongest financial move.
Does a High Days on Market Mean a Desperate Seller?
Not necessarily—and this is where buyers can accidentally misread the map entirely.
High Days on Market (DOM) does not automatically equal a desperate seller or a guaranteed price discount. In a low-inventory environment like Needham's, the DOM metric can be a timing artifact rather than a value verdict. Cash buyers routinely distort the playing field, snapping up the best homes instantly and leaving financed buyers to work through what remains.
"When a home sits for months and still closes at 102% or 106% of asking, it's a sign the market conditions moved, not that the home suddenly improved."
So what does high DOM actually give you?
Leverage—but it usually shows up as terms, not price. Keeping your inspection. Negotiating a credit. Aligning the closing date with your lease or your own sale. Avoiding a bidding war against twelve other offers. Sellers of dated homes are often more willing to concede on contingencies, timelines, or credits than they are to accept a lowball number. Understanding that distinction keeps you from misplaying your hand.
These recent examples make the point clearly:
Data Table
| Property Address | Days on Market (DOM) | Final Sale vs. List Price |
|---|---|---|
| 29 Tolman St | 142 Days | Sold 2% OVER list |
| 556 Webster St | 81 Days | Sold 6% OVER list |
Key Takeaway
A stale listing doesn't mean a cheap house. Use high DOM to negotiate better contract terms—like keeping your inspection intact—rather than leading with a price that insults the seller.
How Should You Negotiate Your Needham Home Purchase?
Getting leverage in Needham this March isn't about negotiating harder. It's about shopping smarter—then structuring an offer that actually fits the micro-market you're in.
Start by targeting stale listings in the weaker micro-segments. Use pre-inspections and realistic contingency strategies to convert a seller's time fatigue into tangible concessions. Think of earnest money like a signal: a larger deposit tells a seller you're serious, even when you're simultaneously asking for closing cost credits to offset that dated kitchen. These aren't contradictory moves—they're complementary ones.
Rather than getting swept up in a bidding war over fresh paint, focus on what actually holds value over time. Look at the fundamental bones of the house. Evaluate the walkability of the neighborhood. Understand the difference between assessed value and market value so your property taxes don't blindside you after closing.
And keep the bigger picture in mind. Needham's school district tiers are a massive draw for inbound relocations, which means your investment stays insulated against future market softness in ways that many other towns simply can't match.
Needham Public Schools — Student Population by Grade (Counts)
Enrollment distribution by grade level (counts) for Needham Public Schools.
Your negotiation map, distilled to one line:
•Turnkey + prime location + great layout = low leverage. Win by being clean and fast.
•Dated + awkward layout + long DOM = high leverage. Win by asking for protections and credits.
Key Takeaway
Focus on the bones, use time on market to negotiate better terms, and let other buyers overpay for curb appeal. That's how you build a smart foothold in a premium town.
Want to Know Where You Have Leverage on Your Street?
Tell me the neighborhood (or a few addresses you're watching) along with your must-haves—beds, baths, budget, timeline—and I'll map out exactly which bucket you're shopping in: turnkey luxury or dated utility. From there, we can get specific about:
•likely competition levels
•a realistic inspection strategy
•where to press for credits versus price reductions
•what "days on market" is actually signaling in that particular micro-area
Reply with your target area in Needham—02492 versus 02494, or even the specific school zone—and I'll pull the most relevant negotiation comps for you.