# March 2026 Inventory Crunch: Turnkey Luxury vs. Existing Turnover in Needham
•The Direct Answer: Needham is not a single, uniform housing market; it is split between Needham Heights, which attracts luxury buyers paying a massive premium for turnkey convenience, and Needham Center, which draws families willing to renovate older homes for better lot sizes and school proximity.
•The Data Reality: Turnkey homes in the Heights are flying off the market in just 9 days at roughly $976 per square foot, whereas older Center homes sit for 60 to 74 days at closer to $658 per square foot.
•The Bottom Line: Your success in the Needham MA real estate market this spring depends entirely on matching your budget, timeline, and risk tolerance to the right micro-market.
Is Needham Just One Big Real Estate Market?
It's tempting to treat Needham Heights and Needham Center as one blended market — same town, same schools, same zip code. Easy assumption. Wrong one.
As of March 24, 2026, how inventory behaves looks dramatically different depending on which side of town you're shopping. Late winter brought an eye-catching ~300% jump in new supply, which set the stage for a busier March. More listings didn't create one calm, "more balanced" market — it created two distinct markets with two very different buyer profiles.
Greater Boston Suburbs (Needham–Wellesley–Newton–Medfield–Dover): February 2026 Market Pulse
Headline snapshot for the five-zip Greater Boston suburbs report (mixed units shown together).
Coverage
PeriodFeb 2026
ZIPs Covered5 ZIPs
Pricing
Median Price (combined)$1,190,000
Year-over-Year Appreciation5.8% YoY
Activity
Closed Sales312
Market Conditions
Avg. Seller Credits$8,640
Seller Credits (% of transactions)28% of transactions
Market TypeSeller’s market
In certain segments, average sale prices jumped 26% month-over-month (MoM) to about ~$1.2M. The blended sale-to-list ratio Needham MA sits around 97% overall.
That 97% can make Needham look "reasonable" on paper — but it's masking a significant split underneath. If you rely on town-wide averages to plan your offer, you risk overpaying in one area or completely missing the winning strategy in the other.
Total February 2026 Activity by ZIP (Sold + Pending)
Compares market velocity across the five ZIP codes using total activity during February 2026.
This is exactly why we can't advise you as if Needham is one monolith. Needham Heights is pulling time-sensitive, well-funded buyers, while Needham Center's resale inventory attracts buyers who want lifestyle fit and are willing to renovate. Same town. Two different games.
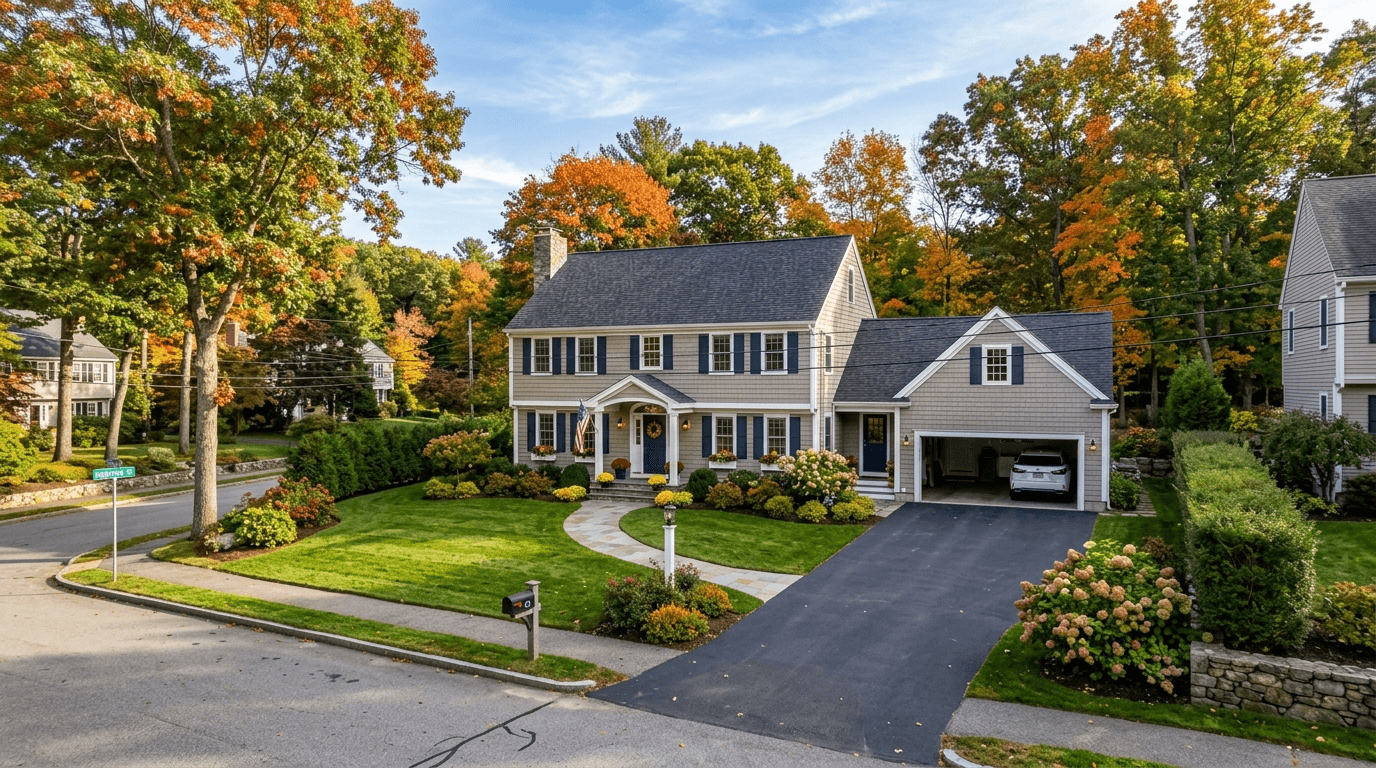
Why Are Buyers Paying So Much for Needham Heights?
If you're shopping Needham Heights luxury homes, your priorities probably look something like this:
•Walkability
•Commuter rail proximity
•Modern layout + move-in-ready condition
•Minimal disruption — no contractor timelines, no renovation surprises
That buyer profile is typically cash-strong and time-poor, and the market prices that reality in hard.
The numbers back it up. Buyers are paying a substantial turnkey new construction premium — an estimated spread of about $506,000 for new or move-in-ready construction compared to older stock.
Median Sale Price by ZIP (February 2026)
Side-by-side comparison of median sale prices across the five ZIP codes for February 2026.
You're not just paying for quartz countertops and new mechanicals. You're paying to avoid risk. In 2026, dodging renovation uncertainty is worth real money — because scheduling delays, permit headaches, and project creep can quietly turn into a lifestyle drain and a budget problem at the same time.
Because demand concentrates on "easy" homes, offer terms get intense fast. Buyers routinely use appraisal gap coverage and contingency waivers to stay competitive.
If appraisal gap language is new to you, here's the plain-English version: you're telling the seller you'll bring extra cash if the appraisal comes in low, rather than asking them to reduce the price.
Data Table
| Market Metric | Turnkey Luxury (Heights) | Older Resale (Center) | The "Turnkey Tax" Difference |
|---|---|---|---|
| Price Per Square Foot | $976/sq ft | $658/sq ft | +$318/sq ft |
| Days on Market (DOM) | ~9 Days | 60 - 74 Days | 51+ Days Faster |
| Active Inventory (02492) | ~19 Listings | 30+ Listings | Highly Constrained |
In the 02492 high-end segment, active turnkey inventory remains extremely tight, with a median list price near $2.64M — and many of these homes disappear in single-digit days.
"You're paying a very real convenience premium — for skipping the renovation, avoiding the project chaos, and eliminating the inspection gamble."
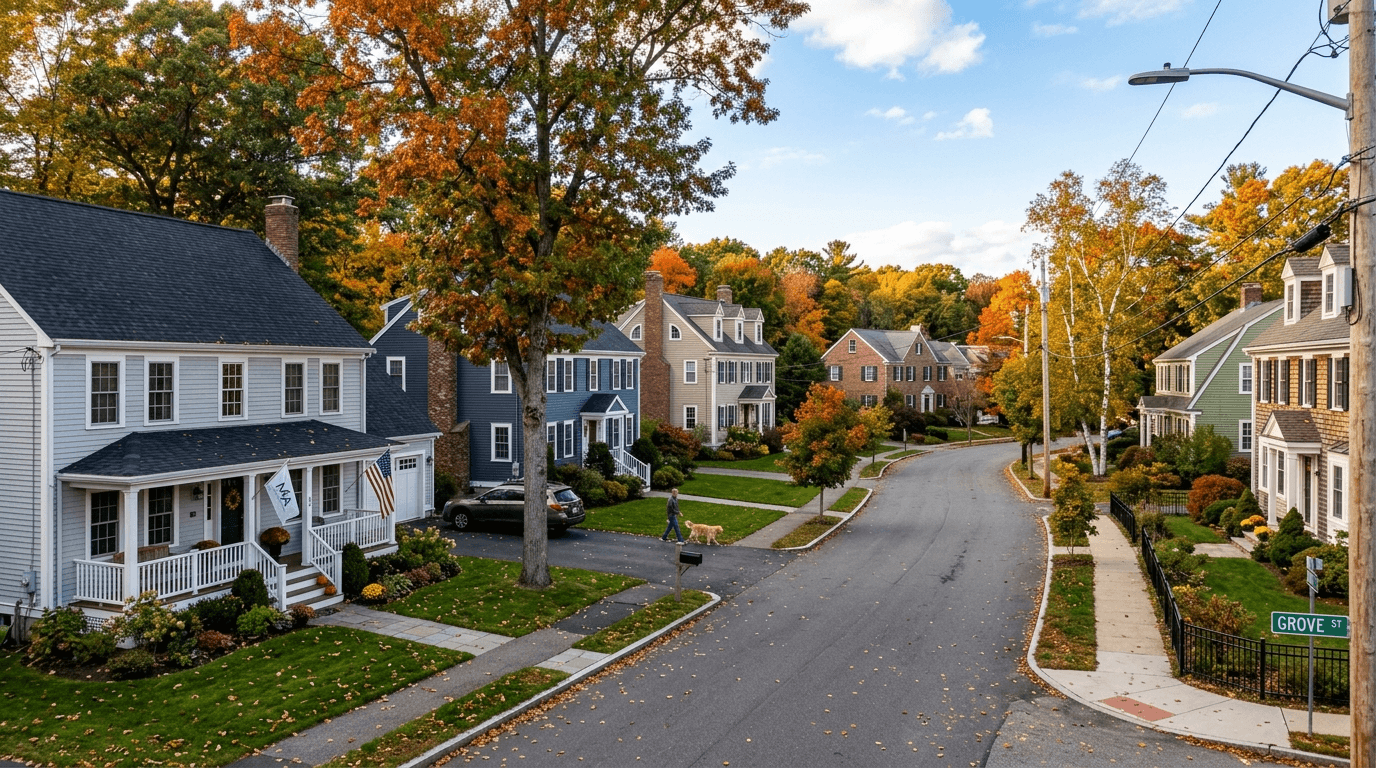
Can You Still Find a Deal in Needham Center?
If Needham Heights is about speed and polish, Needham Center is about patience and potential.
The buyer profile here tends to look like this:
•Families who want lot size
•Buyers who value historic curb appeal
•People optimizing for school proximity and neighborhood feel
•Buyers who are comfortable taking on renovation planning — or at least some deferred maintenance
The school piece is real. And yes, you may be staring at the tax bill wondering if that's normal. Needham's rate can feel steep — but the services, especially the public schools, are a big part of why demand here stays durable year after year.
Top Schools for Math (%): Selected Honor-Roll List
A compact view (top five) of the published math percentage honor-roll list; all values are percentages (max 5 categories for readability).
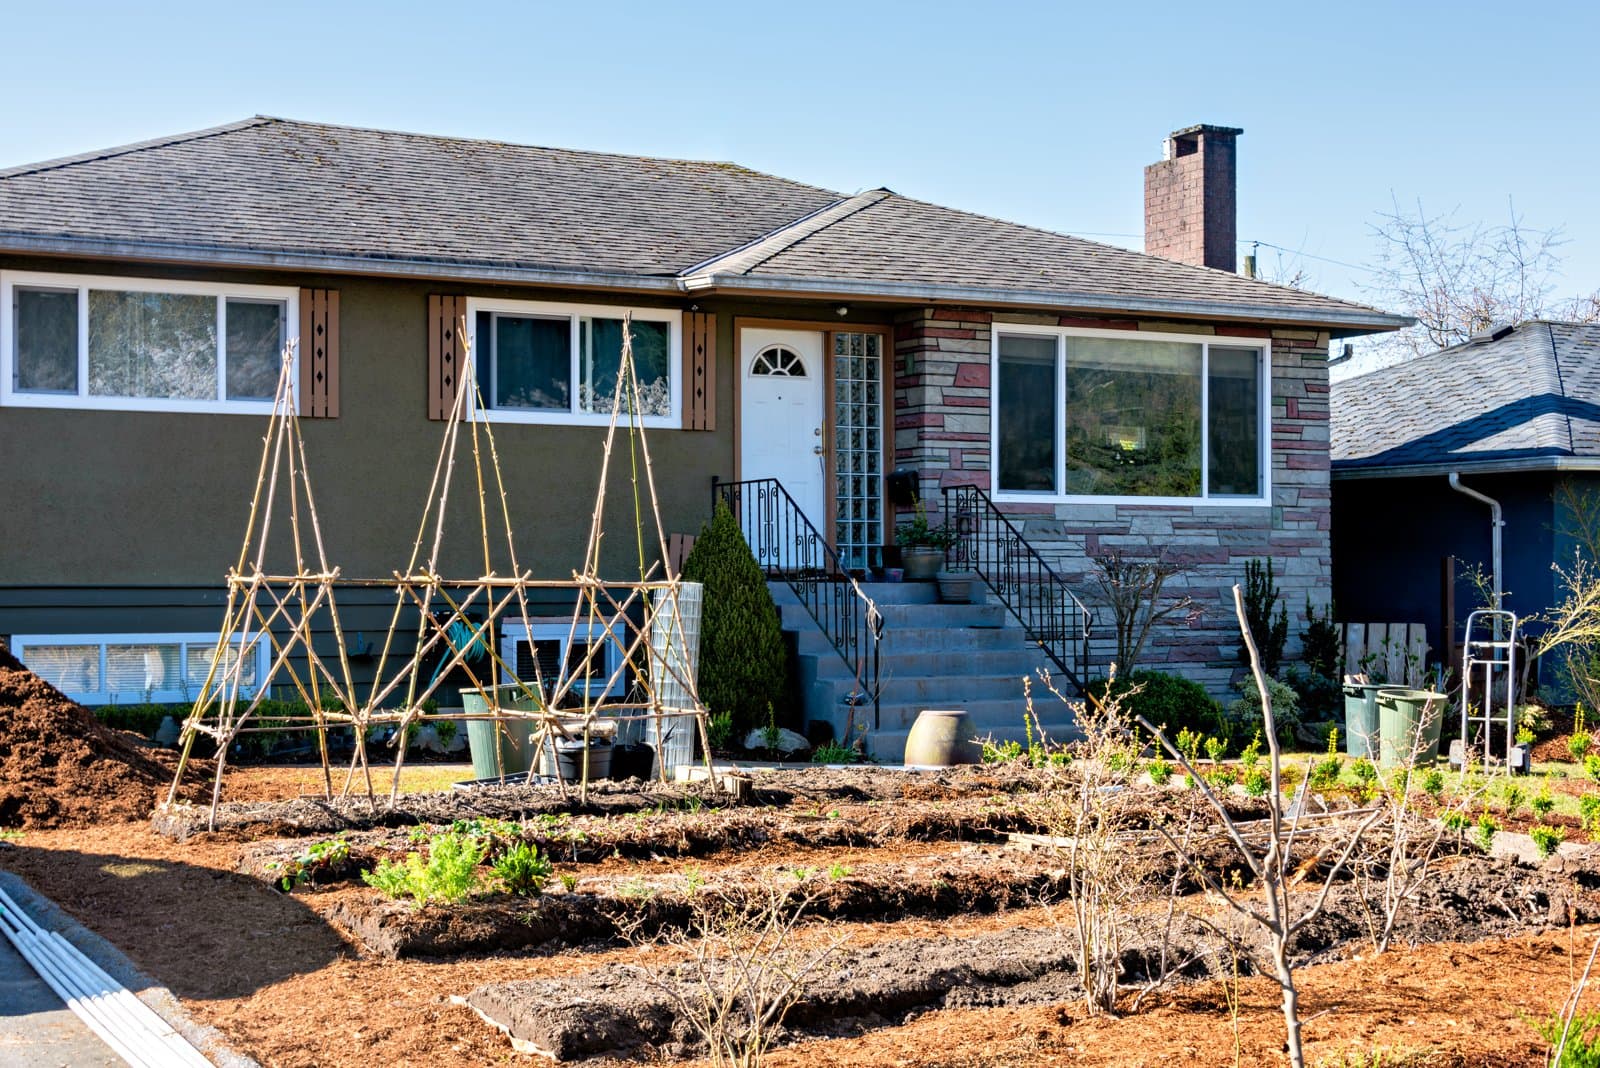
Needham Center homes for sale skew heavily toward older, pre-2001 inventory. That typically means dated kitchens, aging mechanicals, and floor plans that don't quite match what most buyers want in 2026.
Average Days on Market by ZIP (February 2026)
Shows how quickly homes moved (on average) in each ZIP during February 2026.
That's why the price per square foot Needham for these older Center homes averages closer to $658/sq ft — and why they're sitting 60 to 74 days in many cases.
Time on market is leverage. In the Center, you're far more likely to:
•Keep an inspection in place (or at least negotiate intelligently around one)
•Ask for credits or repairs where justified
•Avoid panic-bidding just to stay in the game
One more nuance worth keeping in mind if you're thinking long-term: in the Center, the assessed value vs. market value gap can be meaningful. Older homes may assess lower due to age and condition, yet still command strong market value because buyers are really paying for land, location, and school access.
"When a home sits for months and still closes at 102% or 106% of asking, it's a sign the market conditions moved — not that the home suddenly improved."
Option A vs. Option B: Which Needham Neighborhood Is Right for You?
This is the real Needham Heights vs. Needham Center decision:
•Do you want to pay a premium to protect your time and reduce renovation risk?
•Or do you want to trade time and effort for more space, more lot, and potentially stronger long-term upside?
Option A: The Needham Heights Turnkey Route
•Pros: Move-in ready, zero renovation stress, highly walkable to the commuter rail, modern layouts.
•Cons: You will pay a $500k+ premium, face intense bidding wars, and likely need to waive financial protections.
•Key Difference: You are buying time and convenience.
Option B: The Needham Center Resale Route
•Pros: Lower price per square foot, larger lots, historic charm, closer to top-ranked schools, real room to negotiate.
•Cons: Requires upfront capital for renovations, contractor coordination, and living in a "project" for the first few years.
•Key Difference: You are buying space and potential.
Data Table
| Decision Factor | Option A: Needham Heights | Option B: Needham Center |
|---|---|---|
| Best For... | Busy professionals wanting zero hassle. | Families wanting space and school access. |
| Offer Strategy | Aggressive (waive contingencies, gap coverage). | Measured (standard inspections, negotiation). |
| Capital Required | High upfront cash for premium & appraisal gaps. | Reserved cash for post-closing renovations. |
The Verdict
If you have the capital and simply cannot afford disruption to your daily life, Needham Heights is usually the cleaner fit.
If you want to maximize square footage, lot value, and long-term equity potential, Needham Center often gives you the better chessboard — as long as you're realistic about renovation cost and timeline.
As we move through the March 2026 housing inventory environment, keep this in mind: buyers aren't always losing on sticker price — they're losing on structure. Contingencies, appraisal plans, closing timelines, and certainty of close are what separate winning offers from the ones that don't make it.
"If you aren't ready to move quickly, the inventory you saw may vanish before you can act — so it effectively wasn't inventory for your timeline."
Want a Buyer-Specific Strategy for Heights vs. Center?
Share your target budget range, ideal commute (car vs. rail), and your renovation tolerance (none / light / full), and I'll map out:
•which micro-market is most realistic right now,
•what terms you'll likely need to win,
•and where you actually have negotiation leverage — so you don't give away protections you didn't need to.